Learning Analytics: Diagnose Before You Prescribe
“"This training is useless. Fix it." — three dashboards, forty minutes, one discipline: diagnose first.”
A diagnosis-gated drill: for each cohort choose one of four stories (learning, persistence, measurement, healthy), and only then choose 2 of 6 interventions, scored on whether they act on that story. The debrief lays the three cohorts side by side.
The Audience
L&D teams with LMS reporting duty — plus managers who read dashboards and act on the loudest tile.
Responsibilities
Metric-family analysis · cohort story design · diagnosis-gated UI · intervention scoring — signal vs noise made procedural.
The Build
Learning-analytics design · dashboard storytelling · gated interaction · AI-assisted drafting (disclosed)
How I used AI in this case
AI drafted cohort-comment variants and dashboard copy; the metric-family analysis, the diagnosis-gated interaction and intervention scoring were designed by hand. Edited, verified and disclosed.
The build itself, not a video about it — open it, make the calls, and read what each one costs.
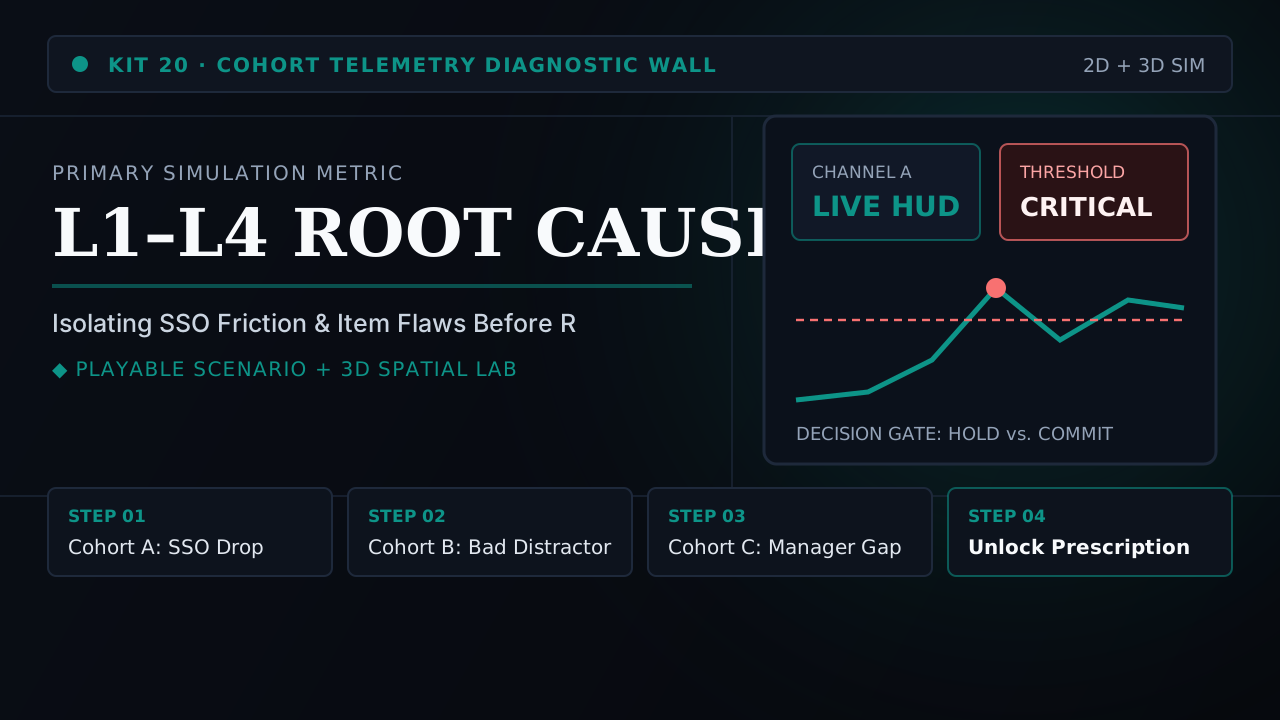
LMS Pulse — Primary Build
The full drill: three cohorts, diagnosis gate, 2-of-6 scoring, side-by-side debrief
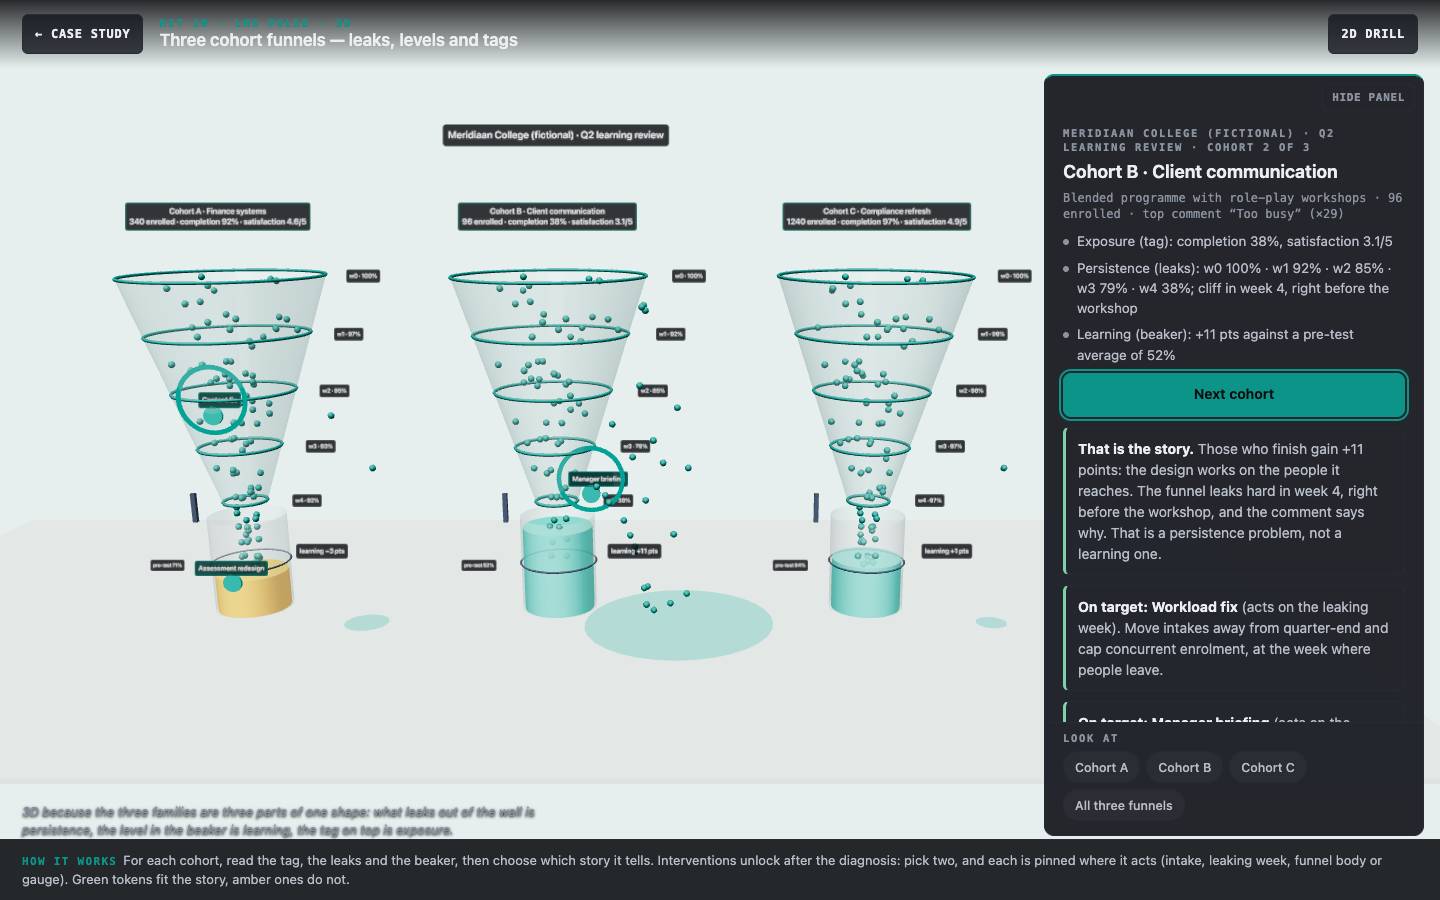
3D cohort funnels
Three funnels of learners: leaks show when people leave, the beaker shows the learning delta against the pre-test. Diagnose each cohort, then pin two interventions where they act.
Scene-by-Scene Storyboard & UI Spec
The three cohorts, the four shared stories, the gate and the scoring, revised to match the build.
Why conventional training failed the operational reality
Learning dashboards reward motion over judgment. The same quarter produced three cohorts with three different truths:
Each of these fails differently — and each attracts the wrong fix if you intervene on whatever is loudest.
Core diagnostic finding
In this fictional brief, quarterly reviews prescribed against the loudest tile: the top comment, or completion. One cohort was redesigned for a complaint while its learning delta was negative; another was nudged when people were leaving for workload reasons; a third was reported as a success on a test nobody could fail.
The loud tile is the trap
Illustrative premise: completion, 4.6/5 satisfaction — and −3 pts on L2. People finished happy and knew no more.
Design Constraint → Build Rule: Dashboards reward the loudest number. The design gates intervention choice behind a correct diagnosis, so acting before reading visibly costs.
Same grammar, different diseases
Illustrative premise: completion with +11 pts on L2. The program works on everyone it touches; the schedule kills it.
Design Constraint → Build Rule: Three cohorts must share a reporting grammar yet hide different root causes — or the drill teaches tile-reading, not diagnosis.
Two of six is the discipline
Illustrative premise: completion, 4.9/5, +1 pt across 1,240 learners. Perfect optics, near-zero learning.
Design Constraint → Build Rule: The intervention cap forces prioritization. Scoring rewards alignment with the diagnosed story, not activity — doing less, chosen better.
Name the family before you prescribe
Performance problem
In this fictional college, the review dashboard mixed exposure, persistence and learning numbers in one grid, and the earlier version of this drill itself filed drop-off under learning. Interventions followed whichever tile looked worst.
Learners and context
L&D teams and programme owners who run quarterly learning reviews. Comfortable with dashboards, short on time; the drill takes about 8 minutes.
Is training the answer? Not on its own
- Missing data. If the LMS reports completion but no pre/post delta, there is no learning family to read; that is a reporting fix.
- Assessment ownership. A post-test learners pass before the course needs an owner and a redesign budget.
- Review template. A review form with three labelled rows (exposure, persistence, learning) makes the sort the default.
Alignment: every objective has practice, evidence, feedback and a route back to the job
| Objective | Practice | Assessment | Feedback | Transfer |
|---|---|---|---|---|
| LO1 Sort dashboard numbers into exposure, persistence and learning | Labelled stats; 3D tag, leaks and beaker | Supports the diagnosis (not scored alone) | Why-text names the family that tells the story | Three-row review template (recommended) |
| LO2 Name each cohort’s story before prescribing | Four shared stories per cohort, shuffled | Diagnosis right: 2 points per cohort | The cohort’s story and why the others do not fit | Diagnosis line at the top of each review |
| LO3 Choose interventions that act on that story | 2 of 6 interventions after the gate | 1 point per fitting intervention | Where it acts and why it fits or not | Intervention log tied to the diagnosis |
Evidence register: what is real, what is invented
- Fictional premise Meridiaan College, the three cohorts, their numbers and comments.
- Design decision The four stories, the intervention fits and the scoring. The earlier copy said “drop-offs measure learning” and “the order you choose is scored”; neither was right, both are removed.
- Not measured Whether review teams change their prescriptions. The “≥ 80% diagnose all three” figure was a target, not a result.
Measurable Performance Objectives
Three objectives, one per step of a review.
Sort dashboard numbers into exposure (completion, satisfaction), persistence (drop-off) and learning (pre/post delta).
Evidence in the build: through the diagnosis it supports.
Name each cohort’s story: a learning, persistence or measurement problem, or healthy.
Evidence in the build: one of four stories per cohort, 2 points each.
Choose two interventions that act on the diagnosed story.
Evidence in the build: 2 of 6 picks per cohort, 1 point each.
Why This Modality Won (Trade-Off Analysis)
Before committing to the final architecture, we evaluated and rejected lower-transfer alternatives against the workplace constraints:
Reasonable first response. Rejected because the team could define every metric — they still prescribed nudges for a cohort whose completion was 92% and learning was negative. Definitions are not the sequencing discipline; the gate in the UI enforces what definitions cannot.
Collaborative and cheap. Rejected because meetings reward the loudest voice, and the loudest voice is precisely the top L1 comment. The drill's whole design — diagnosis before prescription, scored — is what an unstructured meeting cannot enforce.
A diagnosis-gated drill: for each cohort choose one of four stories (learning, persistence, measurement, healthy), and only then choose 2 of 6 interventions, scored on whether they act on that story. The debrief lays the three cohorts side by side.
Why three families
Drop-off is not learning
People can leave a course that teaches well (cohort B) and finish one that teaches nothing (cohort A). Keeping persistence and learning apart is the first move.
Why shared stories
No length cue
The earlier build offered two options per cohort, one visibly longer and more careful. Four stories shared across cohorts make the learner read the numbers, not the options.
Why 3D here
One shape, three parts
Leaks out of the funnel wall, the level in the beaker and the tag on top are three different questions about the same cohort, and interventions land on one part.
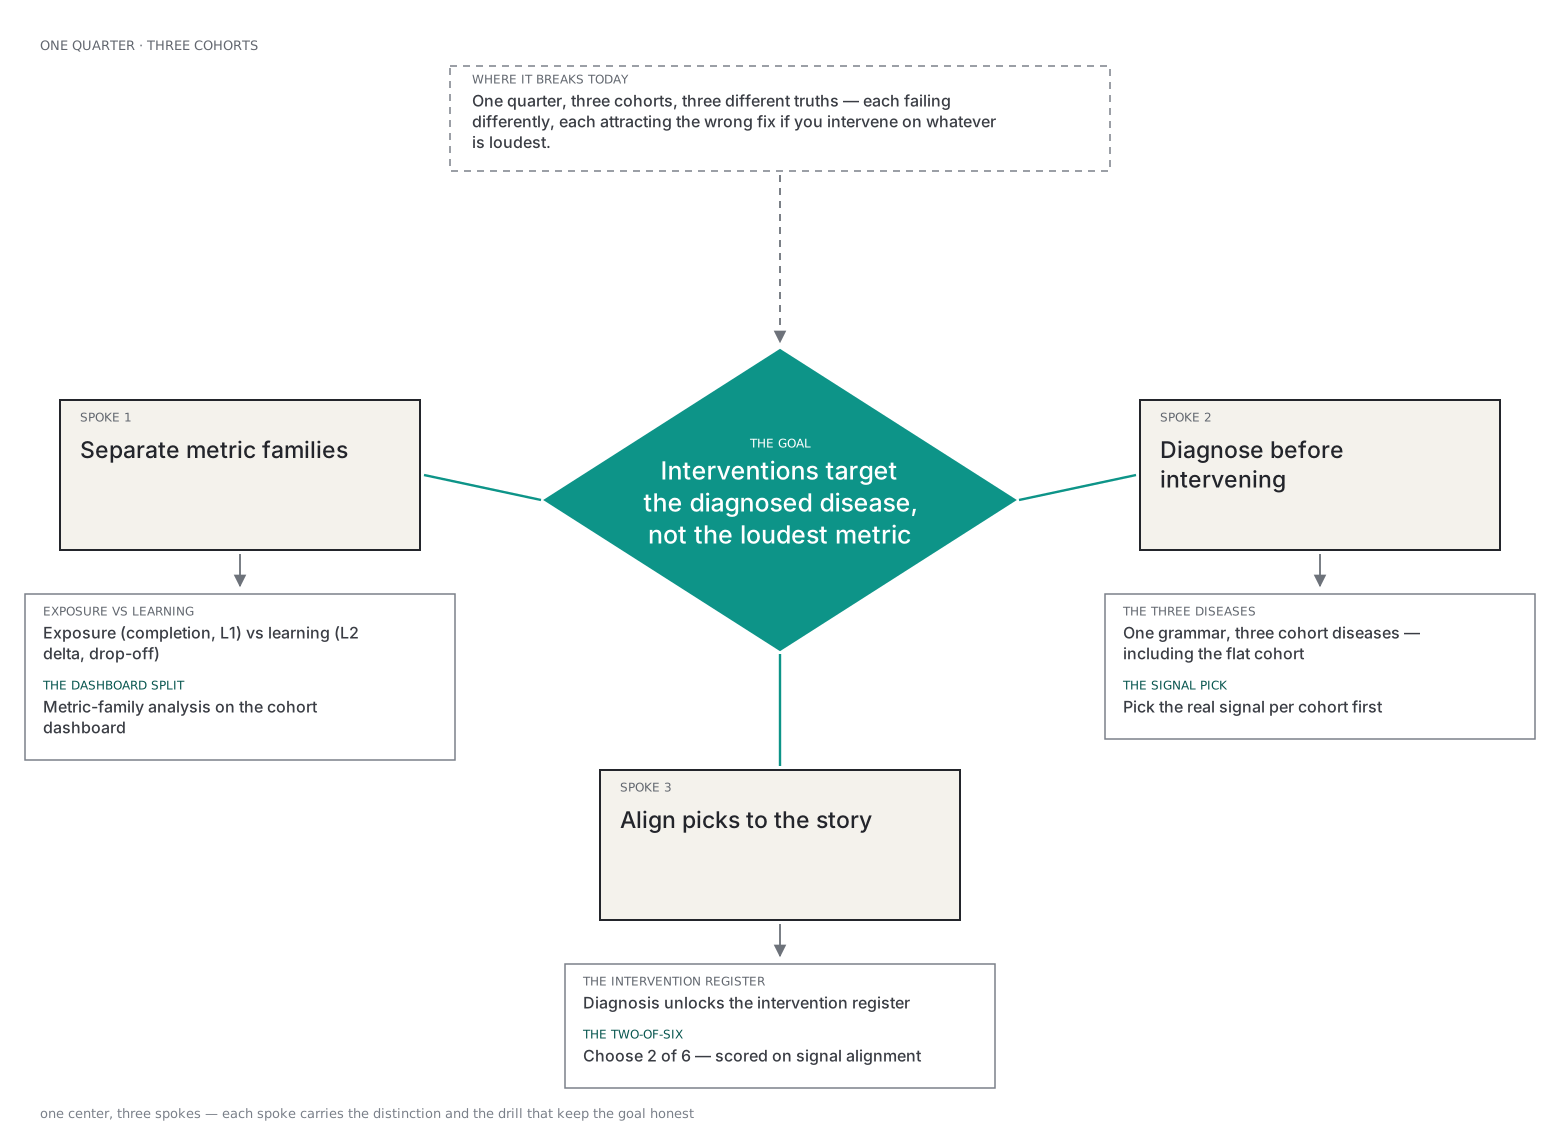
Production Sequence & Traceable Artifacts
The stages below show how the artifacts depend on each other. In this fictional case one designer produced all of them.
What would tell us it worked
A proposed plan. Nothing below has been measured.
| Question | Measure / instrument | When | What we would do with the answer |
|---|---|---|---|
| Do teams diagnose before prescribing? | Diagnoses right per cohort; which story is confused most | Pilot with one review team | If persistence is read as learning, add the three-row template before the drill |
| Do prescriptions follow the diagnosis? | Fitting interventions per cohort | Same pilot | Target 10 / 12 with all diagnoses right on first run |
| Do real reviews change? | Next two quarterly reviews: share of interventions with a stated diagnosis | Two quarters | If absent, put the diagnosis line in the review form |
Instructional Design Takeaway
“Why this form wins: the problem is intervening on exposure when learning is the goal, so the solution locks the prescription behind the diagnosis — same dashboard grammar, three cohorts, three different right answers.”
Quarterly reviews kept producing interventions aimed at whatever was loudest — usually the top L1 comment or the completion number. The drill’s premise: completion and satisfaction measure exposure, drop-off measures persistence, and only the pre/post delta measures learning. Naming which family tells the story comes before any prescription. The proposal was a diagnosis-gated metric drill-down: three cohorts with three different diseases behind one dashboard grammar, and interventions that stay locked until you have named the real signal.
Transparent Portfolio Scope
Honest limitation: a fictional college and invented numbers. Real pre/post instruments need validity work before any of these prescriptions; the drill trains the reading, not the statistics.