New-Hire Onboarding Program: Days to Solo, 41 → 26
“One metric runs this program: days until a new receiver handles chilled loads solo at quality parity. Baseline 41. Target 26.”
A TTP-driven 90-day curriculum in five phases, where every phase names which of the four TTP drivers it attacks (knowledge fluency · environment navigation · confidence · error-recovery), every failure mode gets a designed counter-measure pinned to its risk moment, and Kit 1's certification module returns as a named, scheduled component — not a link in an appendix.
The Audience
New chilled-goods receivers at VanDijk Logistics — seasonal hires and career switchers; buddies and shift leads are the program's co-deliverers, coached through their role.
Responsibilities
Program architecture around TTP · failure-mode analysis from exit data · phase design with named drivers · checkpoint instruments · intervention triggers — evidence-driven, not calendar-driven.
The Build
Curriculum architecture · interactive blueprint (HTML) · measurement framework · reuse of Kit 1 module as a named component · AI-assisted drafting (disclosed)
How I used AI in this case
AI drafted phase-summary and stakeholder-pack wording variants; the TTP phase architecture, failure-mode counters and measurement framework were designed by hand. Edited, verified and disclosed.
The build itself, not a video about it — open it, make the calls, and read what each one costs.
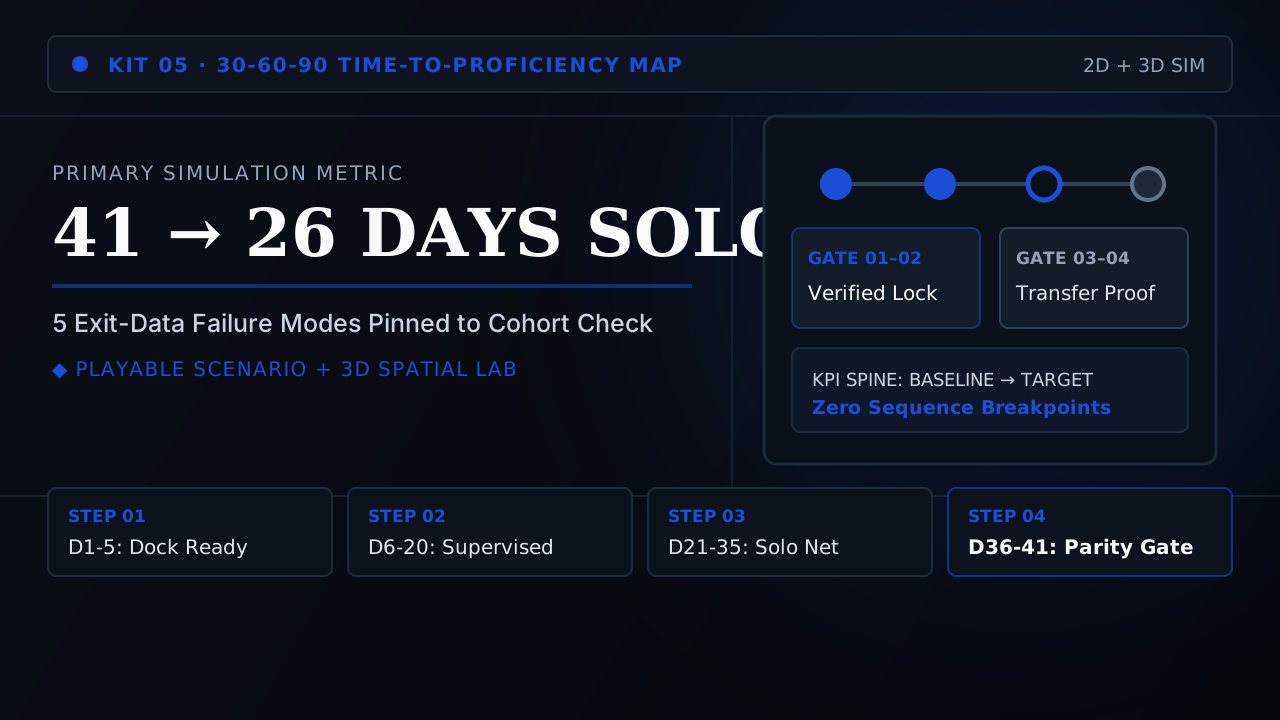
Onboarding Academy — Primary Build
The full program kit: blueprint, stakeholder pack, measurement framework, checkpoints
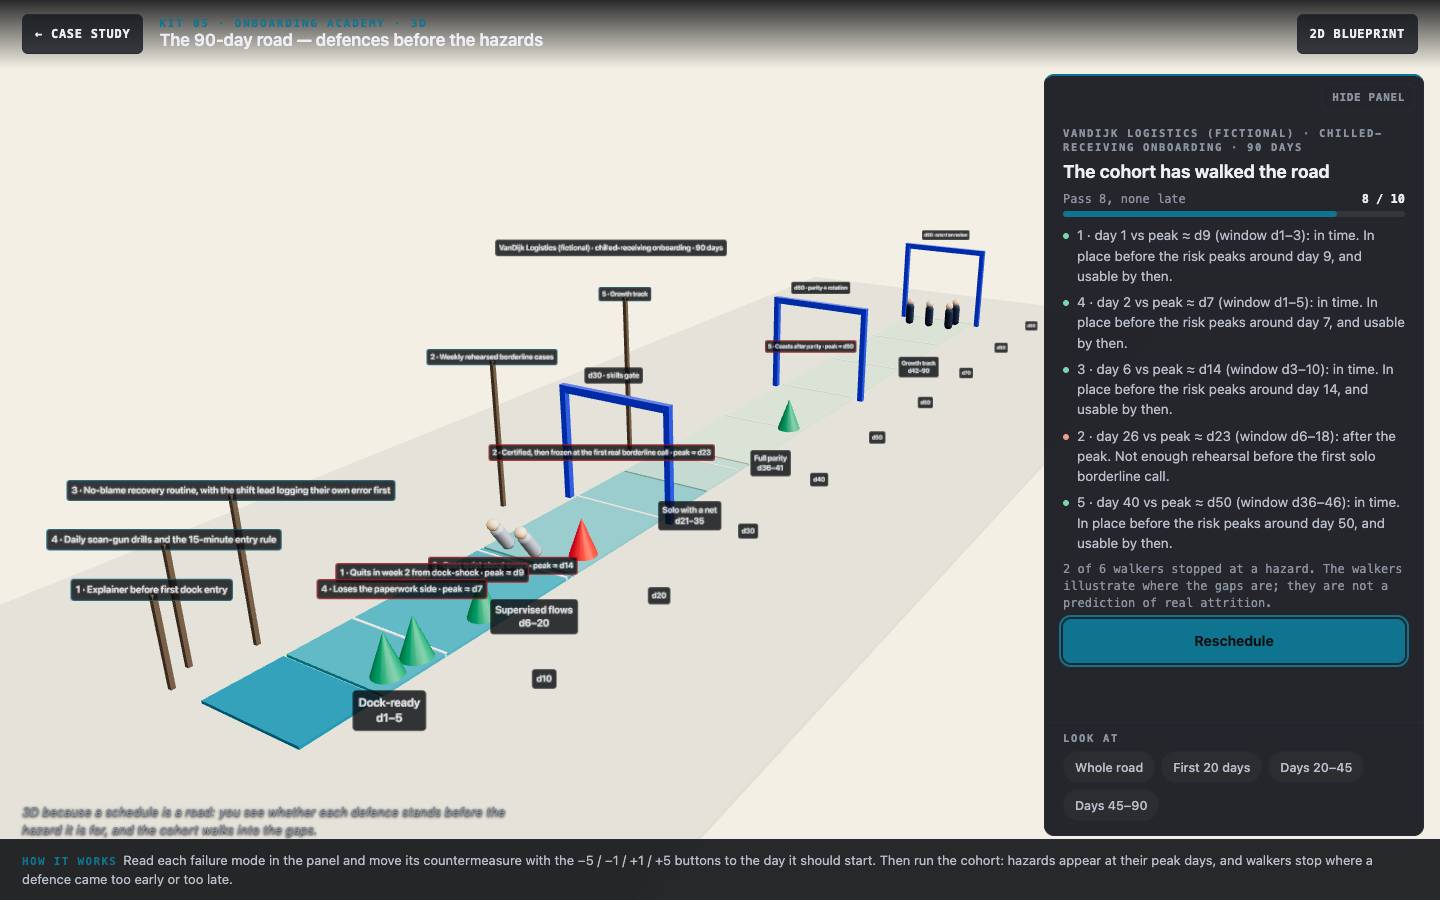
3D 90-day road
Move five countermeasure signposts along a 90-day road, then run the cohort: hazards rise at their peak days and walkers stop where a defence came too early or too late.
30-60-90 Day Curriculum Blueprint
The 90-day map with a scheduling task: place five countermeasures before their risk peaks, then compare with the risk overlay.
Why conventional training failed the operational reality
Baseline reconstruction from scan-log and error data: 41 days to solo quality parity (median of survivors) — and 26% of starters never got there at all. The five failure modes from exit data, each pinned to its risk moment:
Core diagnostic finding
In this fictional brief, new receivers reached solo parity in a median of 41 days, and 5 of 19 never did. The losses clustered at predictable moments: the second week, the first solo borderline call, the weeks after parity. The existing plan was a calendar with no defence timed to any of them.
paperwork drift — records slip once solo
post-parity coasting — parity reached, growth stops
Every phase attacks a driver
Illustrative premise: quit-in-week-2 dock-shock — the cold, noise and pace
Design Constraint → Build Rule: Knowledge fluency, environment navigation, confidence, error-recovery: each of the five phases must name which driver it attacks, or it is a calendar, not a curriculum.
Failure modes from exit data
Illustrative premise: certified-but-frozen — passed the module, can't run a live dock
Design Constraint → Build Rule: Countermeasures are scheduled against risk moments from (fictional) exit interviews. The interactive asks the designer to place them; the peaks appear only after the run.
Reuse with honesty
Illustrative premise: goes quiet on errors — mistakes hide, then compound
Design Constraint → Build Rule: Kit 1's certification module re-enters this program as a named component with its own measurement hooks — reused deliberately, not recycled silently.
Defences before the hazards
Performance problem
In this fictional warehouse, onboarding was a buddy and a calendar. Five failure modes (dock-shock, paperwork drift, silent errors, freezing at the first borderline call, coasting after parity) each peaked at a known point, and most countermeasures, where they existed, started after it.
Learners and context
The programme designer or L&D owner, plus shift leads who run the gates. The new receivers experience the programme; they do not use this blueprint.
Is training the answer? Not on its own
- Rota. Buddy hours in weeks 1–3 and growth-track rotations have to be protected in the shift rota, or the schedule exists only on paper.
- Equipment. A scan gun for every new hire from day 1 removes one cause of paperwork drift.
- Exit interviews. The failure modes depend on exit data being collected the same way every time.
Alignment: every objective has practice, evidence, feedback and a route back to the job
| Objective | Practice | Assessment | Feedback | Transfer |
|---|---|---|---|---|
| LO1 Schedule each countermeasure inside its useful window, before its risk peaks | Five start days, set before the peaks are shown | 2 in window · 1 too early · 0 late; pass 8 with none late | Per countermeasure: verdict, peak day, why early or late | The programme calendar for the next cohort |
| LO2 Explain what each phase contributes to days-to-parity | Phase explorer: drivers, gate, contribution | Not scored (reference) | Phase detail and checkpoints | Stakeholder pack one-pagers |
Evidence register: what is real, what is invented
- Fictional premise VanDijk Logistics, the exit data, the five failure modes and their peak days.
- Illustrative values The 41-day reconstructed baseline, the 26-day target and figures such as “error-hiders quit at 3× the rate”.
- Design decision The countermeasure windows and the scoring.
- Not measured Time to parity and retention under this programme. The earlier page’s targets were not results.
Measurable Performance Objectives
Two objectives for the programme designer. The earlier LO3 (“judge whether a receiver is on track”) had no practice in the build and is moved to the stakeholder pack.
Place the start of each of five countermeasures inside its useful window, before the failure mode it defends against peaks.
Evidence in the build: the scheduling task in the blueprint and on the 3D road.
Explain which time-to-parity driver each phase attacks and what its gate checks.
Evidence in the build: not scored; the phase explorer is reference.
Why This Modality Won (Trade-Off Analysis)
Before committing to the final architecture, we evaluated and rejected lower-transfer alternatives against the workplace constraints:
How it worked before, and how the 41-day baseline was produced. Rejected because variance was the problem: some new hires got a great buddy and thrived, others got a busy one and drifted. The metric needs a designed path, not luck in mentor allocation.
Efficient on paper. Rejected because the knowledge decays before the real workload arrives — weeks three to six, where most failures actually cluster, would remain exactly as unstructured as before. Front-loading is not sequencing.
A TTP-driven 90-day curriculum in five phases, where every phase names which of the four TTP drivers it attacks (knowledge fluency · environment navigation · confidence · error-recovery), every failure mode gets a designed counter-measure pinned to its risk moment, and Kit 1's certification module returns as a named, scheduled component — not a link in an appendix.
Why schedule
Timing is the design
Most onboarding plans list the right activities. The failures come from when they start: a script card after the first frozen call is a debrief, not a defence.
Why hide the peaks
Read, then check
The earlier blueprint showed every risk pin with its fix. Hiding the peaks until the run makes the designer read the failure descriptions and commit.
Why 3D here
A road with hazards
Ninety days as a road makes order visible: you see whether each signpost stands before its hazard, and where the cohort stops.
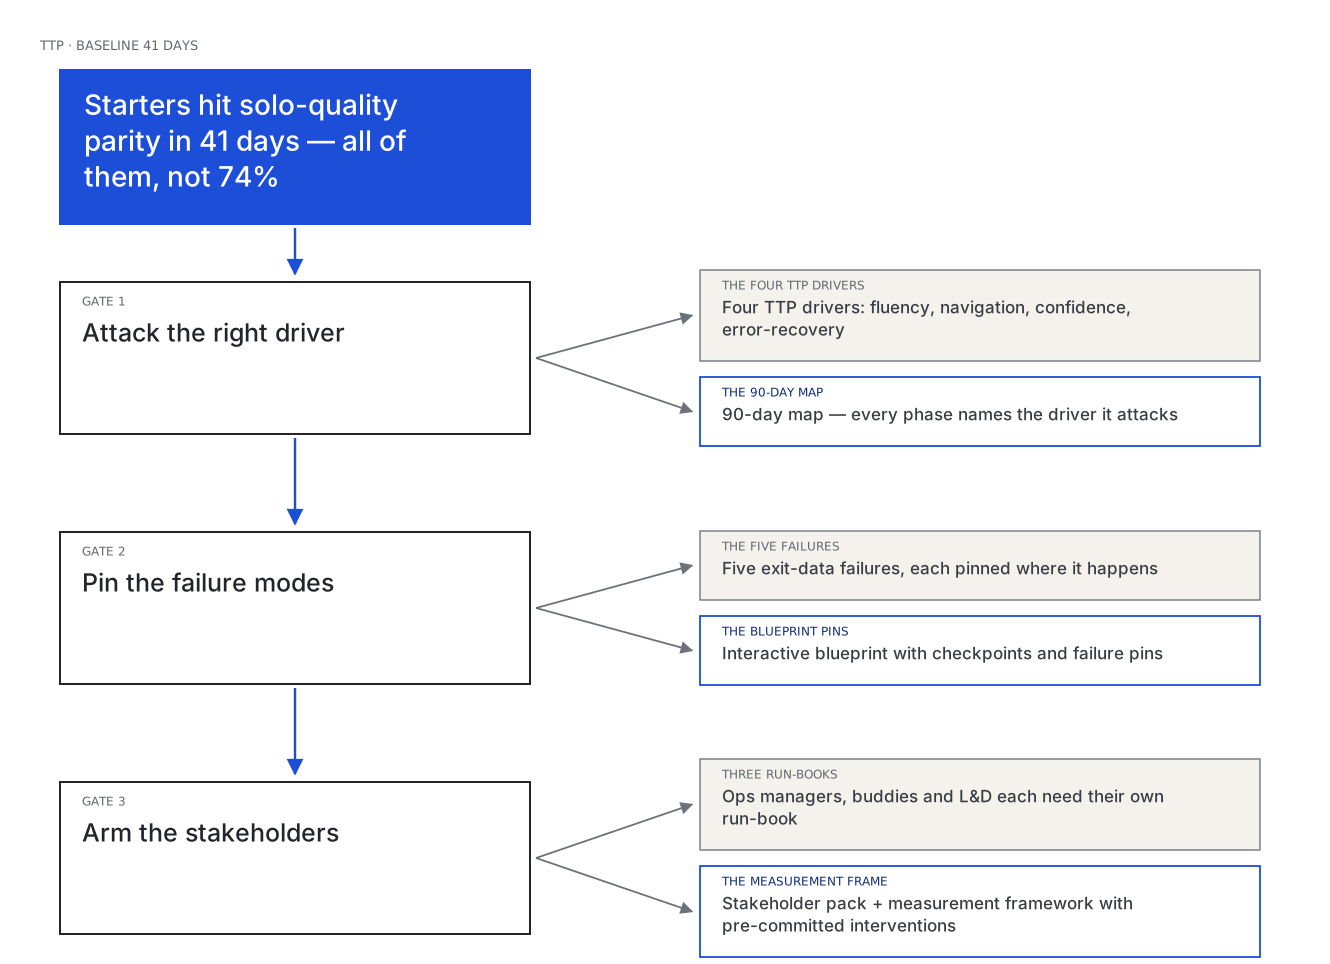
Production Sequence & Traceable Artifacts
From exit-data failure modes to a 90-day TTP curriculum — the stages below link the working documents.
What would tell us it worked
A proposed plan. Nothing below has been measured.
| Question | Measure / instrument | When | What we would do with the answer |
|---|---|---|---|
| Can designers time the defences? | Scheduling-task results; which countermeasure is placed late most often | Review with two L&D owners | If the borderline-call defence is late, make the freeze cue more explicit |
| Does the cohort reach parity sooner? | Median days to solo parity per cohort; starters who never reach it | First two cohorts | Target 26 days; if not, check which gate cohorts miss before changing content |
| Are the defences actually in place on time? | Rota audit: buddy hours weeks 1–3, rotation start dates | Each cohort | If the rota slips, fix the rota before the programme |
Instructional Design Takeaway
“Why this form wins: the problem is a variance-heavy path to a measurable date, so the solution is a phased map with failure modes built into the timeline — and the metric itself (time-to-productivity) as the program's report card.”
The program had one number as its spine: days until a new receiver handles chilled loads solo at quality parity — baseline 41, target 26. Nothing generic could own that number, so the proposal was a 90-day phased program map: five phases, four time-to-productivity drivers per phase, and the five known failure modes overlaid exactly where they bite — so a mentor can see not just what happens in week two, but what silently goes wrong there.
Transparent Portfolio Scope
Honest limitation: a fictional company and an illustrative baseline (a retroactive reconstruction, 5 of 19 starters excluded). The windows are design judgements, not research findings.